3. Step: Detailed Geometry
Both the sound spectrum and the
specific mood of the bars are achieved
exclusively by material-removing process (milling, filing).
If the material is gone and the
desired sound has not been achieved, new material must be obtained.
There is some information in the literature and on YouTube about
the tuning of bars, but they are all rather imprecise.
Here are a few example links:
https://www.youtube.com/watch?v=5PesHXkN2M8
http://faculty.smu.edu/ttunks/projects/merrill/MarimbaH.html
https://www.youtube.com/watch?v=QZPyBDtoYc0
http://www.lafavre.us/tuning-marimba.htm
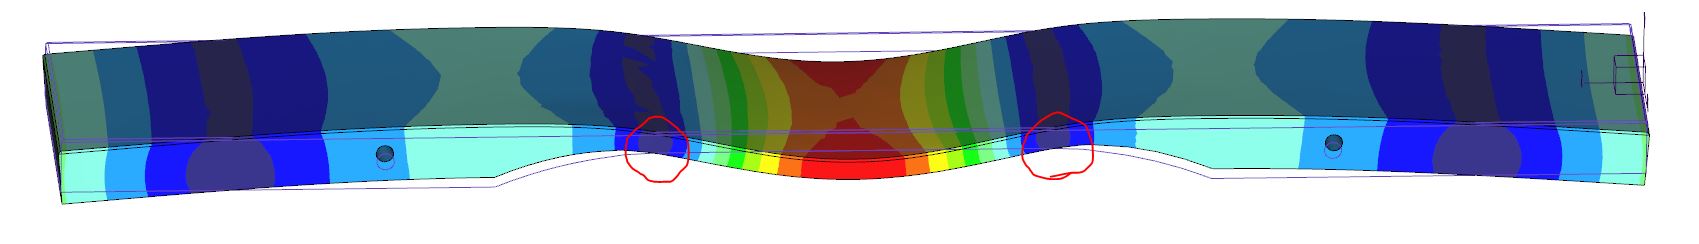
a) Modal Analysis
The "Trial and Error" method can then quickly lead to higher costs, particularly in the case of vibraphones, because of the material and more complex processing.
As engineers, we have therefore used
modal analysis, a special form of structural dynamic simulation, which
is possible with many commercially available CAD systems.
The natural
harmonics
and the normal modes of
oszillation of components
with any geometry are calculated.
The results can be displayed
graphically.
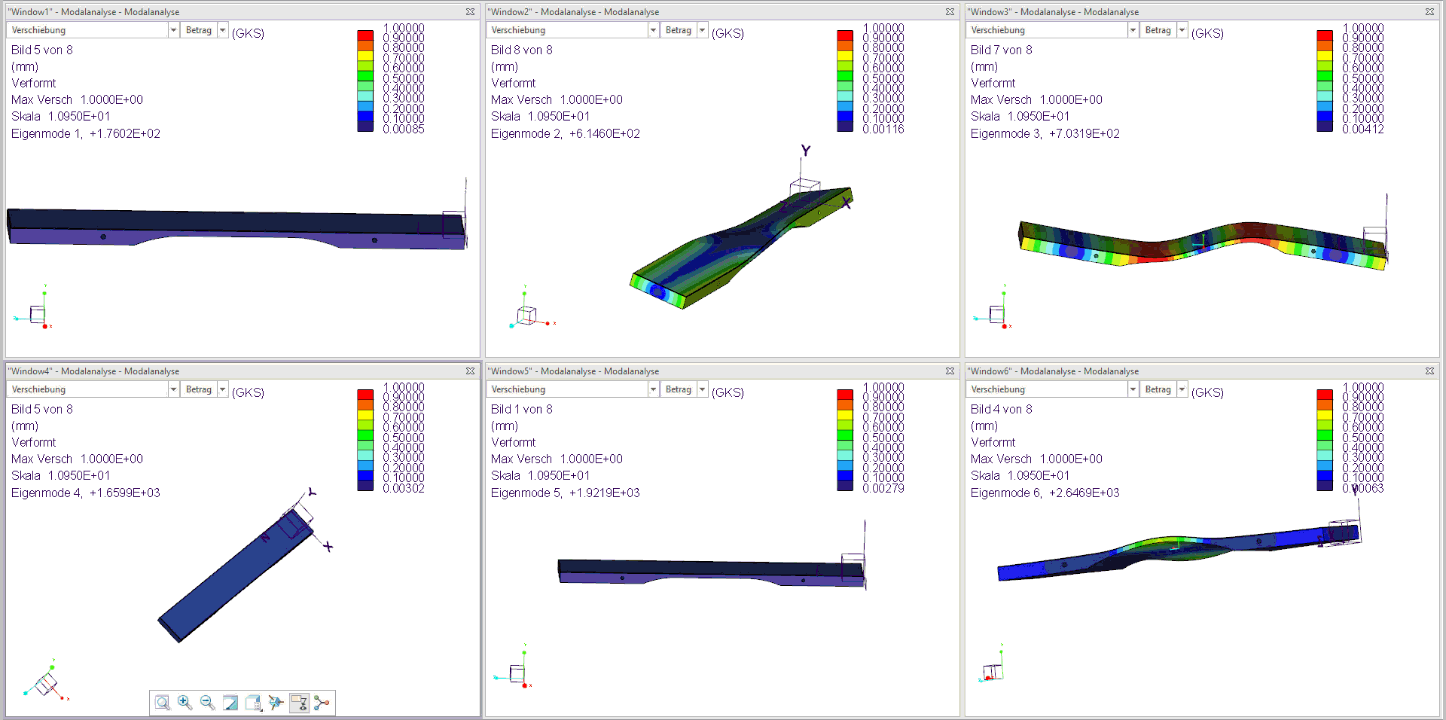
The following figure shows the first 6 harmonics of an already tuned bar (F3):
The 3 tuned natural frequencies 1, 3 and 5 from the simulation therefore fulfill the sound goal from step 1 for the F3 bar with the basic frequency 176 Hz and 4 times the basic frequency (704 Hz). and 11 times the basic frequency (1936 Hz) very good!
We used the PTC simulation module for
our modal
analysis.
https://www.ptc.com/en/products/cad/creo/simulation-analysis/structural-analysis
|
b) First DIY Bar
There are a variety of ways
to edit a rectangular bar so that a
desired sound spectrum is achieved.
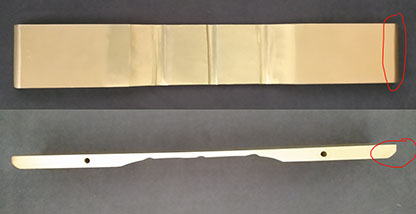
For our first
bar, we chose a somewhat unfortunate
strategy that used the outer edges in addition to the central
cutout.
This bar
was still tuned by hand with the file and the belt
sander.
When placed on the frame, it was shown that the pedal damping had become inconsistent compared to the neighboring bars due to the processing on the edges. Nevertheless, this bar was a great success, since the concrete sound result matched our first simulation perfectly. |
 |
c) Tuning Geometry
We then determined our parametric tuning geometry from a variety of simulations:
First, the size
(radius R, length L and depth T) of the central
cutout is
defined.
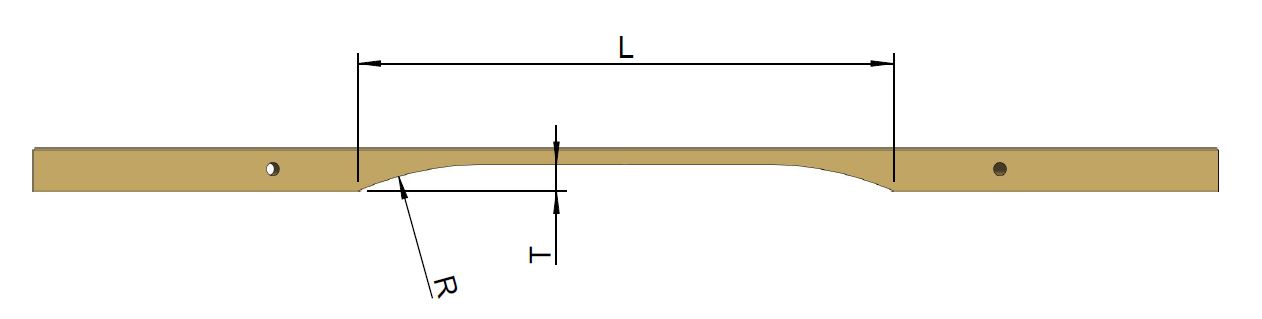
In the second step, the symmetrical lying
tuning points A, described by the depth A, the position xA and the radius RA are
defined.
We made sure that we placed
the location xA in the nodes of the 5th
harmonics.
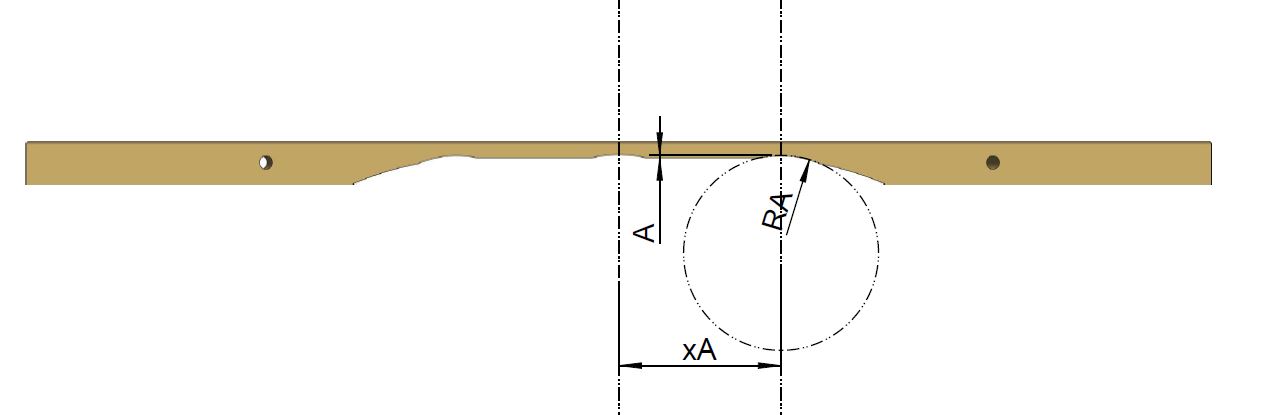
In the third step, the central tuning point B, defined by the depth B and the radius RB, is defined.
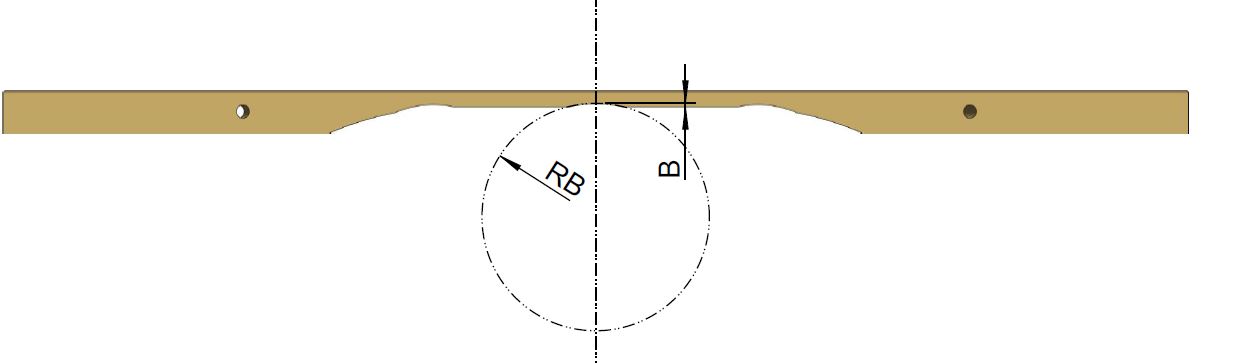
With these 8 parameters, the
tuning
geometry is completely described for a given
bar macro
geometry.
In the case of the higher plates, the length
L is omitted, since the two radii R grow together in the middle.
d) Simulation Quality
The many post-measurements have shown that our
simulations were usually significantly less than 1% error compared to the
actually milled bar.
Thus, the route through a simulated modal analysis is a
very suitable approach.
e) Future Tuning Geometry
As already described in step 2, the surprisingly large tolerance range of the bars thickness (12.0 to 12.3 mm) caused us some problems, which meant that we had to measure all the bars individually before the modal analysis and ultimately - that's a lot worse - the analysis result can not be transferred to a next bar set.
For the next set of bars, we will therefore use thicker material (15 mm) and mill down on both sides precisely to our nominal thickness. Then we only need one set of simulations for all future bar sets that we may want to manufacture.